Visualising Column Level Lineage in Fabric with Neo4j for Data Warehouse Build-Outs
During a recent data warehouse build for a client using Microsoft Fabric, we encountered a common challenge: maintaining clear visibility into data movement and transformations across various layers. This became particularly important as our SQL code-base, managed in GitHub is developing rapidly and is being worked on by multiple developers. In this instance it is difficult to maintain an over-site of the rapid development across sprints and to have the detail to ensure the validity of the data warehouse entities being built. To ensure data quality and effectively manage the impact of changes, a solution for automated column-level lineage was necessary.
What makes this particular tricky is that there is no out-of-box column level lineage solution in Microsoft Fabric.
Our primary needs for implementing this lineage solution were to:
- Effectively track changes and understand our data flows.
- Provide clear progress
- Develop robust documentation that we can hand over to the client’s data engineering teams.
Here’s an outline of our method:
At the conclusion of each development sprint, we utilize GitHub APIs within PySpark notebooks in Microsoft Fabric to extract all SQL code that has been merged into our main development branch. These SQL scripts are located within .Notebook folders and adhere to a standardized format, employing custom --BEGIN_LINEAGE and --END_LINEAGE tags to clearly demarcate the SQL blocks relevant for lineage analysis.
Once these SQL blocks are fetched, we use the sqlglot library to parse and standardize the SQL Abstract Syntax Trees (ASTs). We then inspect each CREATE TABLE AS SELECT or CREATE VIEW AS SELECT statement to map the source columns that contribute to each target (sink) column.
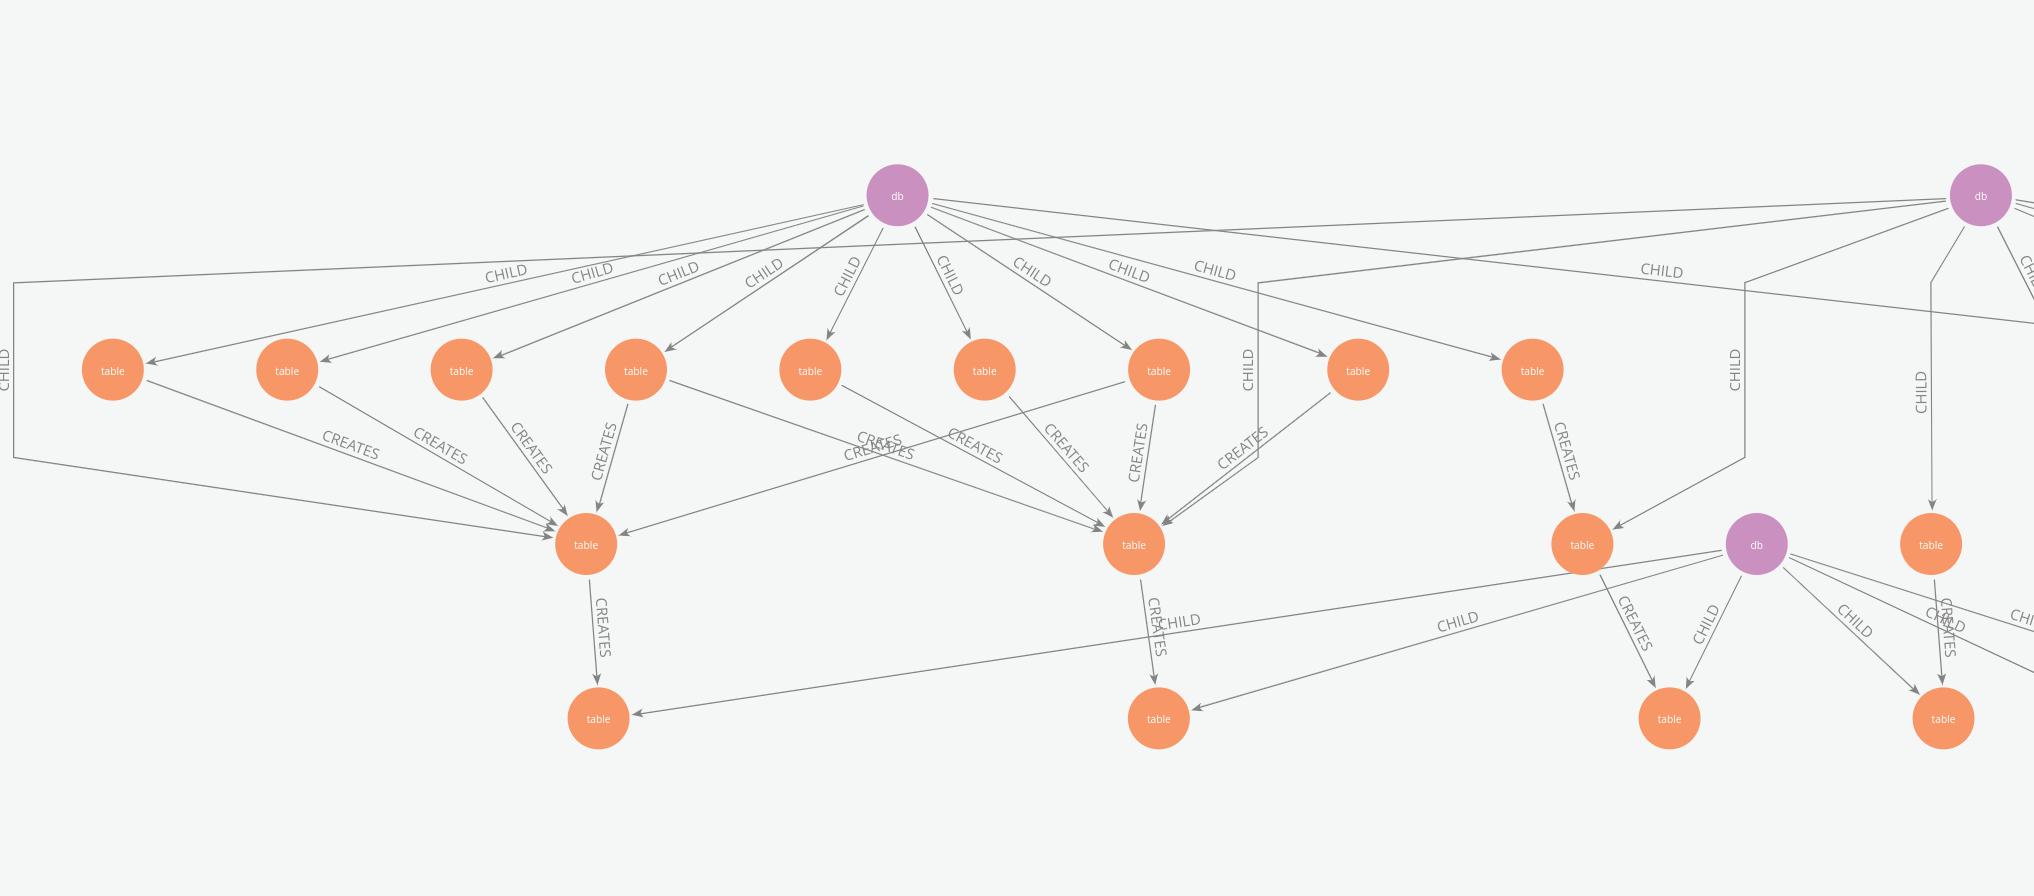
The output of this lineage analysis is persisted to a Delta table. This data then serves two primary presentation layers: Power BI reports for structured overviews and a graph database for interactive exploration. A comprehensive graph model is constructed, representing databases, tables, and columns, with CHILD relationships for hierarchical structure and CREATES edges to illustrate lineage from source to sink at both table and column levels. This model is exported as Cypher (CQL) statements and imported into a Neo4j instance.
Using this graph model, users can search for a specific column (node) and then visually trace all its upstream source columns and downstream target columns. The graph also allows for easy navigation of the parent databases and tables involved in any given lineage path, providing a clear and interactive way to understand data provenance.
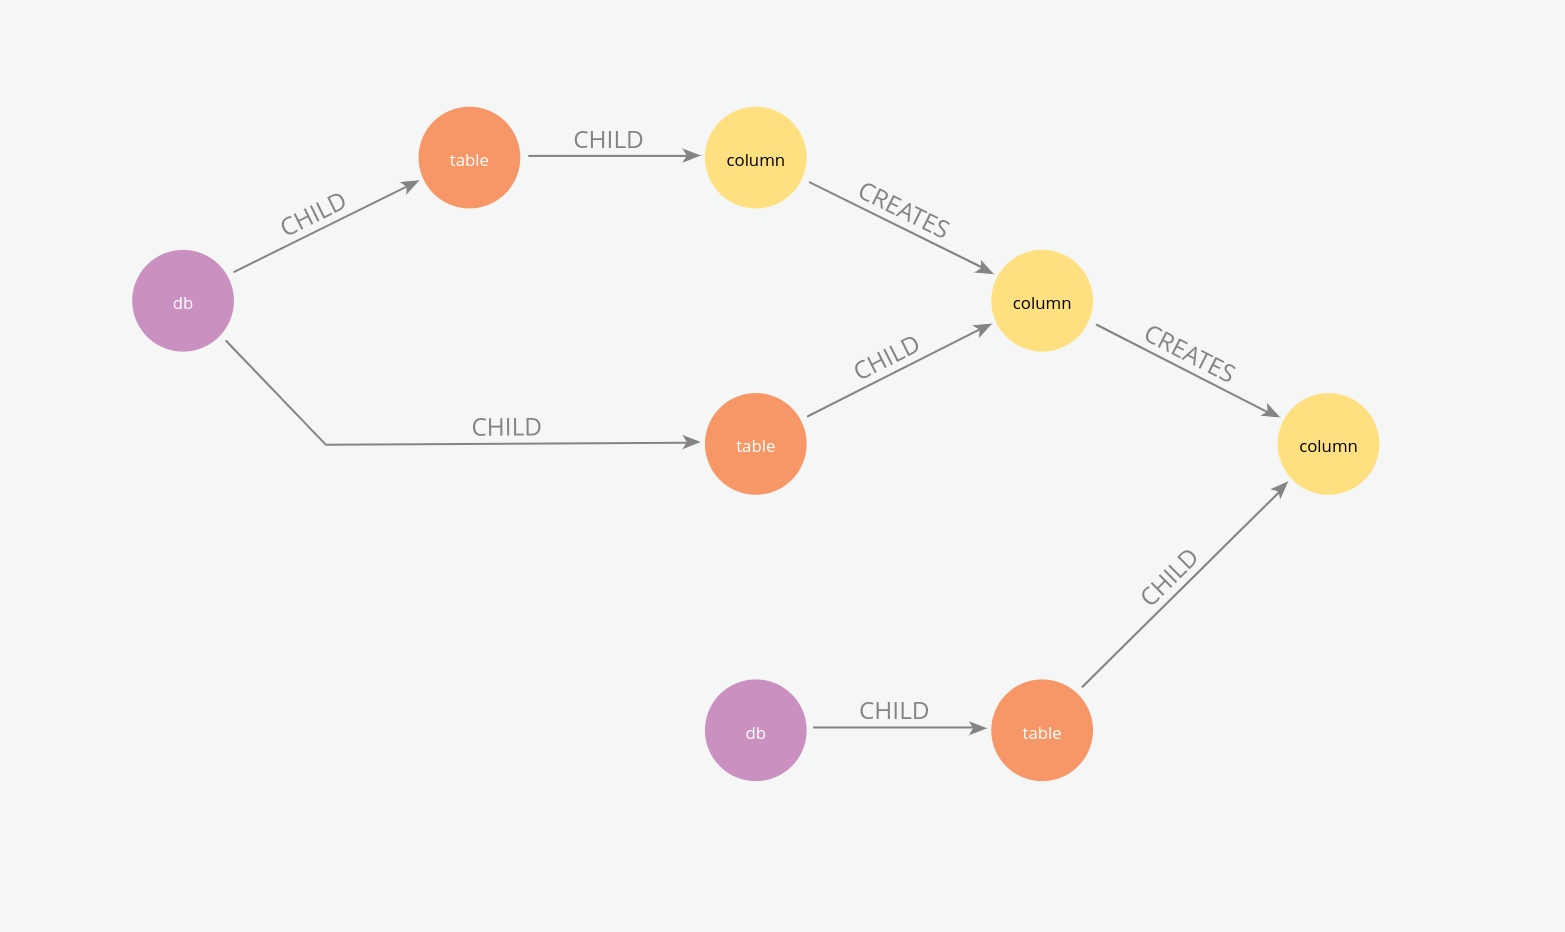 Column lineage (with entity names removed for anonymisation).